Scaling Our World
Purpose
The purpose of this project was to explore and find connections between concepts related to similarity and proportion. The major six we studied and worked on were congruence/triangle congruence, the definition of similarity, solving ratios and proportions, proving similarity between shapes with the angles and sides they had, and dilation and its effects on length and area of shapes.
What we Did
At first, we brainstormed and wrote down on the board what our understanding was of these topics. After some discussion, we formed groups and made research posters on these different ideas and presented so that we could learn more about all of them. Throughout the project, we also did some hand out activities that focused on proportions and dilation. Later on, we made new groups and came up with ideas for objects we could scale. My group chose pumpkin pies, so during one part of the project, we baked pumpkin pies in different sizes and made designs out of whipped cream that were scaled down to the sizes of the pies. Since we couldn’t bring in the final product for an exhibition that was two months away, we made and edited a video instead.
Mathematical Concepts
Congruence and Triangle Congruence
When two shapes have the same side lengths and angle measurements, they are known as congruent. Congruent circles and ellipses would just have the same radii lengths instead of sides/angles. For triangles, there are several ways to prove congruence, such as all three corresponding sides having the same length or two corresponding sides and one corresponding angle.
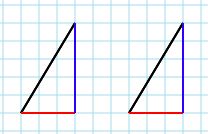
For an example, I’ll look at Side-Angle-Side, when a two corresponding sides and the angle between them have the same measurements in both triangles. In this diagram, the red and blue lines on the first triangle have the same length as the red and blue lines on the second triangle, and they form a 90° angle in both triangles. This means that the two triangles are congruent.
Definition of Similarity
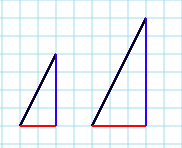
Similarity is like congruency, but it only requires that the two shapes have the same form (ie. angles in polygons) but their side lengths may vary. The two triangles above are similar because all three corresponding angles are the same, but the sides may have different lengths. For example, the angle formed by the black and red lines in each triangle is the same, but the black and red lines’ length in each triangle is different. All three sets of sides share this property, so the triangles are similar.
Ratios and Proportions, and solving them
Ratios and proportions are an important part of this project because they are used in lots of concepts such as solving similar triangles. Ratios like 1:2 (or ½) can be used to solve proportions, like this:

The numbers and variables in the first part of the equation could be replaced with side lengths to solve for unknown sides in similar shapes.
Let’s call the first, small triangle “A” and the second, larger triangle “B”. The red side in A has the length 2, and the red side in B could has the length 3. If we know the length of the blue side in A to be 4, but not the length of the blue side in B, we can set up this equation:
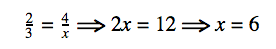
And now we know that the length of the red side in Triangle B is 6.
Proving Similarity
Similar triangles can be proved to be similar if their angles all have the same measurements. In these two triangles, the angles formed by the red and blue lines are 90°, and since the black lines have the same slope, the lines formed by the black and red lines and the black and blue lines are also the same. Since all three corresponding angles are the same, the triangles are similar.
Dilation
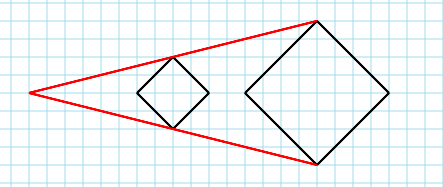
When a shape becomes bigger or smaller without changing form, it is known as a dilation. In this image, the small black shape has the side length sqrt(8), and the large shape has side length sqrt(32), which is twice as large. However, the shape still has the same number of sides and angle measurements. The scale, or amount the shape is dilated, can change how it looks. If the scale is larger than 1, it will be larger. If it’s smaller than 1, but larger than 0, it will be smaller. If it’s less than 0, it will grow bigger and be flipped. If it is 1, it will be the same size.
Dilation’s Effect on Area and Distance/Perimeter
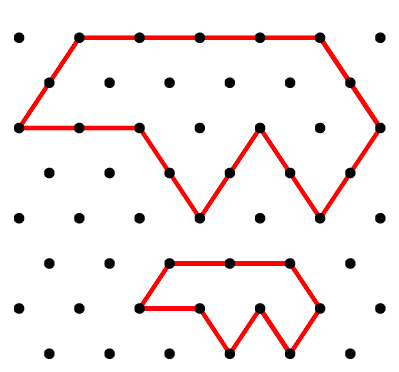
Dilation of shapes can have different effects on perimeter and area. In one activity we did, we measured a “bear” drawn on isometric grid paper that was dilated to different sizes as it grew. The perimeter had a linear progression, but the area’s progression was more quadratic and rose quickly rather than steadily. For example, the perimeter of the bottom bear is 9 and the perimeter of the top bear is 18, but the area of the bottom bear is 7 and the area of the top bear is 28. If the bear grew by a scale factor of three instead of two, the perimeter would be 27 and the area would be 63.
Connections
The Relationship Between Similarity and Proportion
Similarity and proportion have a strong and important connection. It’s possible to make proportions/ratios from corresponding side lengths of shapes. If some side lengths are unknown, they can be substituted by variables that can be solved for in these proportions.
The Relationship Between Dilation and Similarity
Dilated shapes will always be similar shapes. In the diagram in the section on Dilation, the two squares are similar. Dilation doesn’t change angles or the number of sides, it changes the side lengths proportionally, and that’s the definition of similar shapes.
Connections to Benchmarks #2 and #3
In benchmarks 2 and 3 of the scaling our world project, my group tried our best to scale pumpkin pies. We used different sized circular pie pans that could be thought of dilations of each other, and so, they are similar. We also scaled a snowflake design out of whipped cream on top of the largest pies. The scale factor was around two for the pies and the snowflake, but since we had to make do with pie tin sizes that didn’t have exactly 2:1 ratios with each other, the scale factor wasn’t perfectly 2 for some sizes.
Exhibition
Benchmark 1
For Benchmark #1, all we had to do was answer a few questions about our group and what we would be doing. I talked about how our original plan was to scale ingredients as well and to also have more pies ready for exhibition, but the exhibition was moved to December and we had to scrap that plan by Benchmark #2.
Benchmark #2
This benchmark was when our group came up with a recipe for pumpkin pies that we would be using for the project, as well as drawing a basic design to make out of whipped cream. We tried several, such as faces and circular patterns, but the snowflake we drew was the least terrifying and looked the nicest. We also figured that since the exhibition wouldn’t be until December and Christmas time, it would be nice to have a festive display with snowflake pies.
Once we found a recipe and began to think about the math, we chose a scale factor of 2 for the pies and the design on them. We thought that 2 would work, because we all already had 9” pie tins and 4.5” would be easy enough to find.
Benchmark #3
This benchmark was when we got down to business and actually baked some pies. We found out that we didn’t actually have 4.5” pie tins but only 5”, so we also used some 2.5” muffin tins as well, to keep the scale factor going. We also realized that instead of pumpkin, we bought pumpkin pie filling mix, so we just used one can for a large pie, half a can for a smaller pie, and then around a quarter of a can for a 2.5” mini pie.
Reflection
I think that I and my team members did really well on this project. There were a couple of times when the pies weren’t really working as planned, or the scale factor wasn’t going well with what we had, but we were able to push through. Besides the pie making part of the project, I think I did great as well. I had an easy time on the handouts and I was able to complete them easily. I quickly understood the concepts we studied, even though some were review. I enjoyed this project and what we did during it.
